

AAVEUSDTRSI mean reversion
TWBuys oversold conditions and shorts overbought conditions using RSI, with range and volatility filters. Positions exit on signal normalization or protective orders.
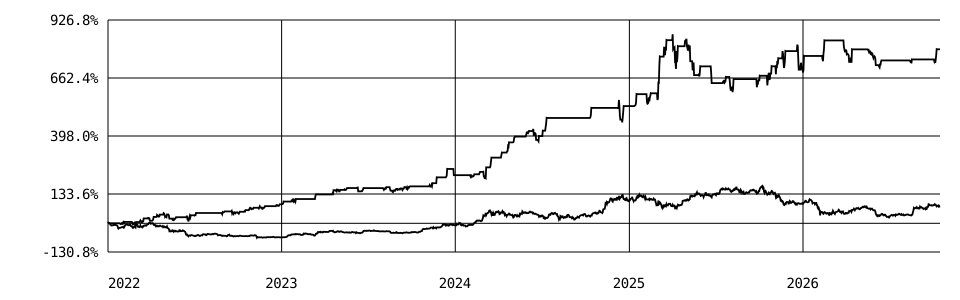
Cumulative return
Drawdown
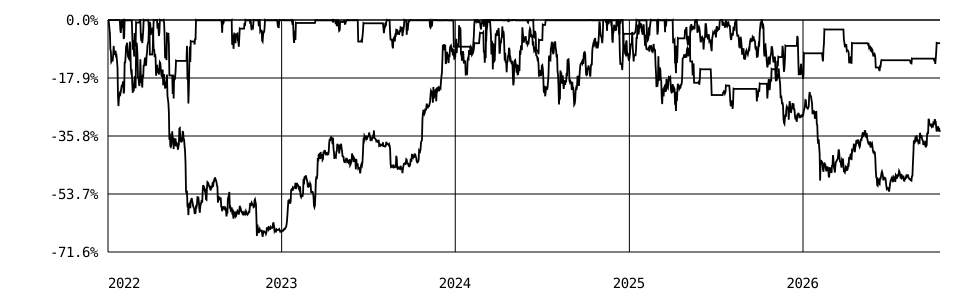
Daily observations. Headline Max Mark DD uses the full native-resolution simulation.
Strategy profile
- Direction
- Long & Short
- BTC filter
- No
- Protective stop
- ATR
- Signal exit
- Yes
- Exit rules
- Signal / stop loss / take profit
- Position sizing
- Notional allocation
- Backtest start
- 2022-01-01
- Backtest end
- 2026-10-16 (exclusive)
- Closed positions
- 81
- Profitable trades
- 75.31%
- Best calendar month
- 41.19%
- Worst calendar month
- -13.32%
- Longest daily underwater spell
- 562 days
- Daily return volatility
- 1.81%
Rolling 12-month return
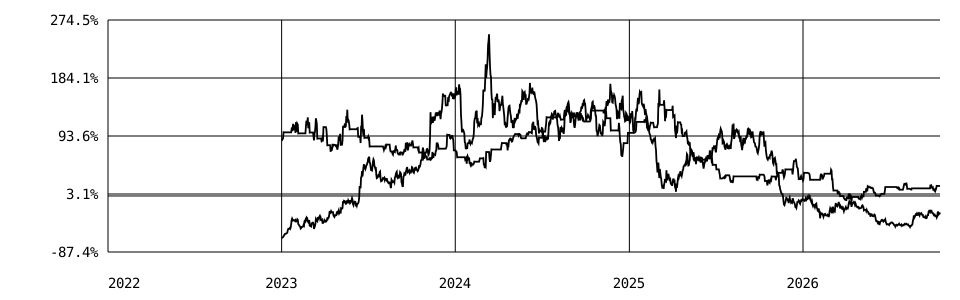
Trailing calendar-year return, without annualizing shorter windows. The first 12 months have no values.
Quarterly returns
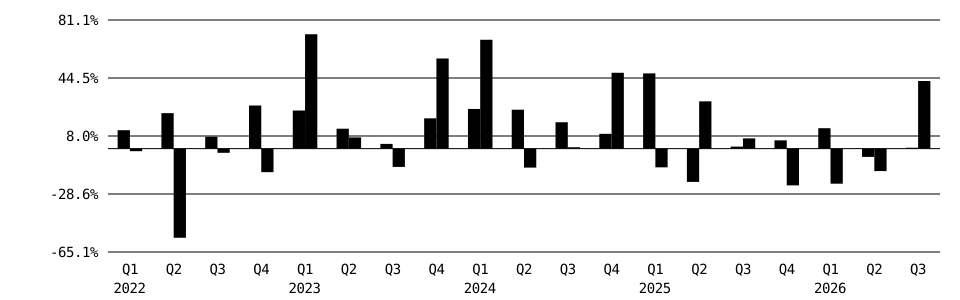
Full calendar quarters only; partial quarters excluded. Consistency is the share of these quarters with a positive strategy return.
Time below previous peak
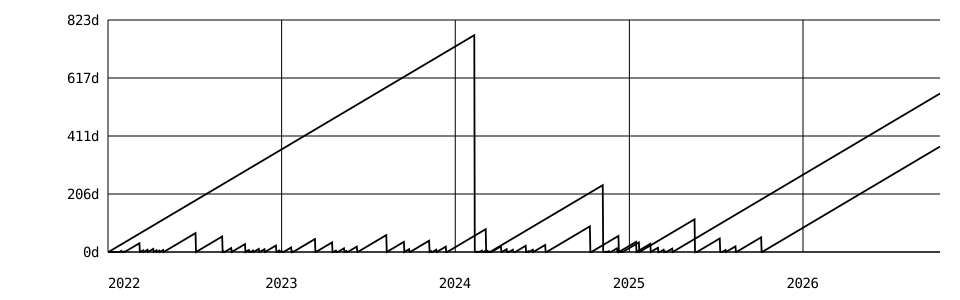
Days since the previous daily equity peak; resets to zero when that peak is recovered.
Rolling 90-day BTC correlation
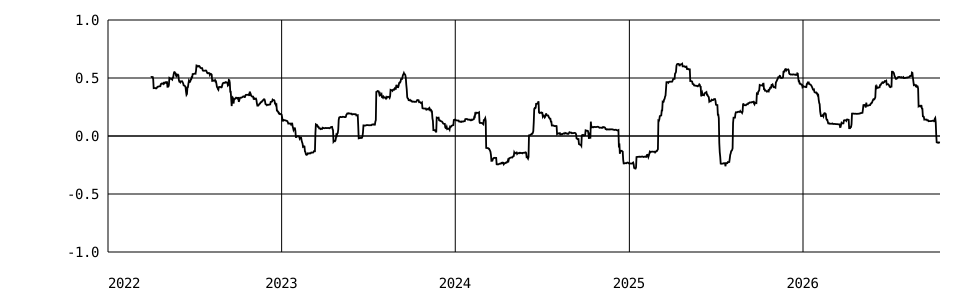
Correlation of daily returns over 90 complete daily observations, from −1 to +1. Gaps mean undefined correlation. This does not indicate whether BTC is used in signals.
Monthly returns / %
Calendar-year performance
| Period | Strategy | BTC hold |
|---|---|---|
| 2022 | 86.68% | -64.24% |
| 2023 | 71.18% | 155.62% |
| 2024 | 98.48% | 121.29% |
| 2025 | 24.14% | -6.33% |
| 2026 | 13.44% | -6.18% |
First and last periods may be partial. Returns are not annualized.
Reading this report
Both curves begin at zero percent on the same effective start date. BTC is a spot buy-and-hold benchmark.
Profitable trades counts fully closed positions after costs and funding. It is not the percentage of positive days.
Different start dates describe different market histories; compare periods before comparing rankings.
Methodology & limitations
Historical simulation. Closed-bar signals and next-open execution; fees, slippage and historical funding included. BTC spot benchmark includes entry costs and no perpetual funding. Account value is compounded continuously without annual resets.
Observed research periods are not untouched out-of-sample data. Daily analytics use QuantStats; headline financial metrics use the saved backtest. Current instrument constraints are applied retrospectively. Leveraged simulations do not model exchange liquidation. Calculation cutoff: 2026-10-16, exclusive.